T3 SURVEYThe 2027 T3 Advisor Tech Survey is open. Please rate Tolerisk (P5 isn't listed yet). We're hoping for a 10!Rate Tolerisk in the 2027 T3 survey. We're hoping for a 10!Take the survey →
The leading risk tolerance provider will receive significant support and counsel from experts with a broad range of industry knowledge and tenure.
a provider of fiduciary-caliber risk tolerance assessment technology for investment advisors, is excited to announce the formation of its Advisory Board, comprised of 10 industry leaders with expertise in financial planning, insurance, fintech, business development, legal and compliance, and more. These individuals will leverage their diverse skills and knowledge to offer guidance, direction and feedback to the Tolerisk executive team through the firm’s evolution and growth.
“We’re so fortunate at Tolerisk to have the support of the industry leaders on our board, whose insights will help us refine our solutions and better position our platform to meet the evolving needs of financial advisors and their clients,” said CEO Mark Friedenthal. “The diversity of experience and perspectives will be especially valuable to help guide our next phase of growth and development.”
Designed for fiduciaries, Tolerisk is a risk tolerance software application that accelerates practice growth and reduces compliance risk by making the complex easy to visualize, understand, and document. Tolerisk sets itself apart from traditional risk tolerance assessment tools, which focus primarily on the client’s willingness to accept risk, by incorporating their cash flows to measure both willingness and ability to take on investment risk, along with a constantly updated assessment of the shifting risk in the markets.
“Both brokers and investment advisers need to have reasonable controls to supervise that the financial professionals are making recommendations and providing advice that is in their client’s best interest,” said Miriam Lefkowitz. “Firms need tools to assess whether clients with similar profiles and risk tolerances are exposed to materially different levels of risk. Among other supervisory use-cases, Tolerisk can help firms use a uniform scale to risk rate actual client portfolios so there is firmwide consistency.”
“What Tolerisk is doing for risk tolerance is a fiduciary revolution,” said Michael Raneri. “Both clients and advisors have been historically underserved by other risk assessment tools, which fail to consider an investor’s ability to take risk or validate client assumptions, leading to the potential for risk directive advice that isn’t based on their personal financial circumstance.”
Colin Slabach added, “As an Advisory Board member for Tolerisk, I am thrilled to contribute to the work they are doing in the realm of risk tolerance assessments. Their innovative methodology has the potential to profoundly reshape the advisor-client relationship, fostering increased understanding and trust.”
Most recently, Tolerisk earned a standout 8.17 user rating in the 2023 T3 Inside Information Software Survey’s Risk Tolerance Instruments category. To learn more about the software, visit https://p5wealth.com/.
About Tolerisk
Headquartered in Marlton, N.J., Tolerisk® is an analytical risk-tolerance assessment tool used by all types of financial professionals to help their clients figure out how much risk to take in their investment portfolio as well as the probability that they’ll outlive their money. For more information, visit https://p5wealth.com/.
Custom integrations enable comprehensive advisor oversight, compliance standardization & a new level of client experience for the enterprise organization.
MARLTON, NEW JERSEY, June 21, 2023 — Tolerisk, a leader in analytical risk tolerance assessment tools, announces a custom integration with WealthSource Partners, a full-service, national, independent registered investment advisory firm.
Tolerisk’s software enables a two-dimensional approach to risk assessments, not only quantifying an investor’s willingness to accept investment risk, but also assessing their ability to take on risk in a scientific manner. The tool allows financial advisors to objectively measure their clients’ risk tolerance and understanding of the probability of outliving their money to empower better planning and increase client confidence.
“We wanted to build out a platform that enabled all of our systems to work seamlessly together while empowering the fiduciary process across our advisors,” said Jason Mirabella, Chief Operating Officer at WealthSource. “When we looked at the risk tolerance landscape, Tolerisk stood out as a tool that would not only allow us to scientifically and accurately analyze risk and evaluate portfolios, but also aggregate that data between our CRM and client-facing experience solution. They’ve proven to be a true partner in bringing our fiduciary vision to life.”
To meet the national firm’s needs, Tolerisk developed several customized integration capabilities, including making API endpoints available to smooth out data entry, capture and flow between systems for WealthSource’s advisors. Tolerisk also enabled WealthSource to link outside data sources for portfolio composition by enhancing their existing integration with Orion, allowing WealthSource advisors to bring in and score current account holdings.
Tolerisk also accelerated several items on their product roadmap, building an innovative comparison functionality that enables advisors to score a client’s current portfolio in comparison with the risk directive selected by the client or recommended by the advisor. With the ability to track this data, WealthSource can now better ensure that recommendations made by its advisors are in the best interests of its clients and in line with its fiduciary duty.
“We’re excited to be able to develop the risk tolerance solutions that empower WealthSource to maintain their fiduciary standard across their entire book of advisors,” said Tolerisk founder Mark Friedenthal. “WealthSource’s commitment to acting in the best interests of their advisors and clients by standardizing compliance mirrors our own dedication to consistently delivering best-in-class analytical capabilities that enable advisor and client to work more confidently together toward client goals.”
Headquartered in Marlton, N.J., Tolerisk® is an analytical risk-tolerance assessment tool used by all types of financial professionals to help their clients figure out how much risk to take in their investment portfolio as well as the probability that they’ll outlive their money. For more information, visit https://p5wealth.com/.
About WealthSource Partners
WealthSource Partners is a full-service, national, independent registered investment advisory firm. The firm’s partnered independence platform serves entrepreneurial advisors who are eager to grow, and to do so on their own terms. Supported by an experienced practice management, marketing and operations team, WealthSource Partners empowers advisors to focus on their niche and the unique elements of their practice. Through the Advisor Platform Management Office (AdvisorPMO), WealthSource’s robust practice management and marketing platform, advisors can simplify their day-to-day and offload non-client-facing activities to spend more time serving clients and engaging prospects. For more information on what WealthSource is building, please visit wealthsource.com or contact us at jdubravac@wealthsource.com.
The first generation of financial planning (1970s through 1990s) used static modeling with a constant return expectation. The chief limitation was that it didn’t accurately reflect the real sequence of returns observed, which created very unrealistic results and underrepresented the risk of failure. In this century, financial plans were primarily conducted using single-factor Monte Carlo simulations (the second generation of financial planning), which addressed the sequence of return risk. While a vast improvement over the first generation of financial plans, typical Monte Carlo simulations still have material weaknesses in how they represent potential future circumstances. The most notable weaknesses include the assumption of a constant risk level (determining expected return), a constant volatility (standard deviation) for potential portfolio returns, a single path for potential inflation and a constant terminal point for evaluating the simulation. The third generation of financial planning mathematical infrastructure has emerged, pioneered by Tolerisk (2012), which incorporates additional variables to more realistically reflect potential future outcomes.
The First Generation – Static Models
As computing power evolved, the ability to incorporate more intricate cash-flow assumptions improved. General assumptions for portfolio returns, taxes and inflation expectations evolved. Even life expectancy changed and thus the time horizon for the financial plan increased. These improved assumptions enhanced the reliability of the outcome. However, they were often biased based on the then current economic climate (e.g. late 1970s/early 1980s with inflation and interest rates above 10%), which didn’t necessarily accurately reflect an uncertain future.
The chief limitation of the first generation of financial plans was inherent in the portfolio return assumptions. An individual could be lucky enough to retire at the beginning of a strong market or unlucky enough to retire at the beginning of a weak market economy. The difference could be as stark as success or failure. Assuming, for example, a 6% return every year ignored the massive variance that occurred during most retirement horizons.
The Second Generation – Monte Carlo Simulation
For the last two decades, financial planning systems have been dominated by Monte Carlo simulations. These generally run 1,000 or more randomly generated paths of potential portfolio returns. They are usually calibrated to a single volatility (standard deviation) and expected-return assumption, both driven by the user-specified risk level of the portfolio. These simulations generally hold the risk level constant, although some allow a subjective change at a specific time in the future. Practitioners commonly assume a singular reduction in portfolio risk directive upon retirement. While the typical financial planning Monte Carlo simulation randomly generates potential return paths, it is most common for them to utilize a single path for future inflation. This may be customized by the distribution of expenses for the client and may change over time as the composition of expenses evolves. These generally do not vary with each potential path of portfolio returns in the simulation.
Monte Carlo simulations are a big advancement compared to static models, primarily because they address the sequence of return risk prevalent in financial plans. However, Monte Carlo simulations used in financial planning models have a number of common limitations and short-falls when considering the range of potential realities of a person’s financial future.
The fact that financial plans can often be 50+ years for younger clients inherently makes some of today’s Monte Carlo assumptions unreflective of the realities of a long-term future. The notion that the volatility of the stock market (or bond market or inflation) would be constant for 50 or 60 years isn’t appealing when considering how varied volatility has been historically. A similar weakness exists when contemplating the constant correlation between stocks and bonds for 50+ years. Simply the fact that inflation is generally modeled as a single path and doesn’t vary reduces the reliability of the simulation results. One shouldn’t assume that risk and mortality are constant either, given the uncertainty of tomorrow’s reality.
Although not as popular, during the same time period that Monte Carlo simulations took off, some advisors and planners began running multiple static scenarios that incorporated portfolio return variance as observed historically. Frequently 30-year periods were considered as a representation of a realistic retirement period. Some plans used rolling 30-year periods, where there might exist 60 rolling 30-year periods in a 90-year history. The criticism of this approach is that the middle 30 years amidst the 90-year history would be counted more than the first 30 years or the most recent 30 years. This disproportionate weight to the center of the data set used, combined with the limitation of a small number of potential paths (e.g. 60 rolling 30-year periods), may have prevented this approach from garnering more interest, as it was overshadowed by Monte Carlo simulation models.
The Third Generation
Cutting-edge financial planning mathematics remediates the key weaknesses in the application of the typical Monte Carlo simulation in financial plans. It utilizes long-dated and detailed historical data to create (nearly) infinite paths without the use of random numbers. The 1,000+ paths have historical frequency and relevance without the limitation of over- or under-weighted historical periods. It utilizes separate paths for equities, fixed income, and inflation. This process also incorporates the dynamic volatility and dynamic correlations between each data series. By employing an objective measurement of someone’s ability to take risk, an evolving custom glidepath for risk in the future can be incorporated into all aspects of the analysis. Further, this process layers in customized, last-survivor probabilities by year into the simulation.
By adding an evolving risk directive and dynamic inflation and mortality to the simulation process, a more robust and realistic representation of potential future outcomes is achieved. Here are the key aspects of this dynamic modeling:
Risk directive – By measuring the mathematical ability (capacity) to take risk now and in the future, a dynamic, customized glide path for risk in the future can be incorporated into all aspects of the financial plan and its analysis. Most advisors recognize that today’s risk level is not necessarily the most likely indication of the client’s risk level in the future. The appropriate glidepath for risk will likely evolve as the client migrates towards and through their future cash-flows.
Inflation – Using a separate set of 1,000+ paths for inflation (CPI), the sequence of real (inflation-adjusted) return risk is addressed. There may be periods of time when returns are generally average but inflation is materially above expectation, which can compromise a plan because higher future costs would deplete future asset values. Conversely, there may be periods of below average portfolio returns that are accompanied by inflation that is below expectation, which may not compromise someone’s financial longevity. The sequence of real returns is a more realistic contributor to financial planning success than simply the sequence of nominal return risk.
Volatility – Using paths with evolving volatility better represent the observable history in stocks, bonds, and inflation. Even over extended periods of time, we note significant historical variance of volatility itself.
Correlation – By using separate paths for stocks, bonds, and inflation, each of which with dynamic volatility, we inherently create variable correlation between these series as it occurred historically. In reality, we observe that correlations between stocks, bonds, and inflation can change materially, even over long periods of time.
Mortality –Recognizing and incorporating the variable mortality both individually and amongst a last-surviving spouse improves the validity of measuring the probability of failure. It also eliminates the need to exaggerate the static terminus to accommodate the increased probability that at least one individual within a couple will survive to an advanced age.
Conclusion
By introducing additional variables to the simulation process within a financial plan, a more realistic and reliable representation of probable outcomes will be achieved. The third generation of financial planning incorporates dynamic correlations between stocks, bonds, and inflation as well as dynamic volatilities of each data series. It incorporates dynamic risk directive expectations that evolve as clients migrate towards and through their cash-flow series. Layering into the simulation process the customizable, last-survivor probabilities per annum facilitates an encompassing probability of outliving one’s money, currently the most robust metric in planning technology.
This latest generation mathematical infrastructure is now available broadly through API integration, licensed by Tolerisk. It can be utilized by financial planning software, robo-advice solutions, recordkeeping technology, and more. If you are interested in learning more about how Tolerisk’s next generation mathematical infrastructure can elevate your financial services application, please contact us: integrations@tolerisk.com.
Mark Friedenthal is founder and CEO of Tolerisk, a cloud-based SAAS tool for financial advisors to provide better risk tolerance assessments for their clients.
At a high level, there are 4 causes of a broken financial plan. But, first, let’s define “financial plan”. A financial plan accounts for anticipated savings and spending, incorporates assets, income sources, longevity, and yields some probability of running out of money. A sound financial plan should attempt to ensure a person’s lifespan does not outlast their resources. Ideally, a plan also allows one to maintain their lifestyle permanently. However, this isn’t categorically a requirement if anticipated decreases in spending are forecasted beforehand.
A broken financial plan sees a client’s resources completely depleted prior to end of life. These four events are the primary drivers of a broken financial plan, and advisors should be prepared to explain them…and help clients avoid them.
Loss of Income – Primarily this concern is during one’s career, causing a depletion in savings until one finds a new source of income. This risk can also be accompanied by a difficulty in replacing income at the same level as previously produced. Loss of income could be caused by a disability which may be protected through insurance. However, loss of income caused by economic recession is more difficult to manage. If income loss or decrease is prolonged, often financial plans need to be adjusted. This may cause spending curtailment or delaying retirement if some work is obtained.
Unexpected Expenses – Any sudden or unanticipated expense, whether health related or otherwise, can stress a financial plan. Sometimes it may simply divert funds from other discretionary uses. In other cases, it may cause a change in lifestyle or a delay in retirement. By definition, these are unexpected and difficult to incorporate. It is usually prudent to allow some room for the unexpected in a financial plan.
Prolonged Low Real Returns – It’s important to recognize that it’s generally “real” returns (portfolio returns relative to inflation) that contribute most heavily to financial longevity. While most financial planning tools use simulated paths for potential future portfolio returns, specifically to capture sequence of return risk, they often only use a single path for inflation. In scenarios where returns are average or perhaps even above average, when they are accompanied by very high inflation, the real return is low. In financial planning terms, the portfolio may perform as expected or even a bit better. At the same time, however, expenses rise much faster than expected. They deplete the portfolio at a much faster rate, causing duress on financial longevity.
Living to an Unanticipated Age – People are living longer and longer, as science and medicine allow us to live with ailments and conditions that our parents and grandparents could not. This too can put stress on a financial plan. Most advisors run their financial plans to an above average life expectancy or 90 or even greater. But, what if one spouse lives to 100 or even 105 or 110? While it may seem far-fetched, the number of people living that long has increased significantly in the last 50 years. One way to improve the analysis of financial longevity is to incorporate mortality probabilities for each spouse. Being able to incorporate 2nd to die probabilities, especially when they can be customized to reflect the person’s health, habits, and heredity, are particularly powerful in a financial plan. From a practical stand point, having some guaranteed income for life is one way of protecting against the financial drains of a very long life.
Conclusions
So, what can advisors do to reduce the chances of a broken financial plan?
Generally speaking, operating with spending and retirement plans that produce a low probability of running out of money is the safest way to reduce the chances of failure late in life. But, scrimping and saving every month and working through old age isn’t always the best plan either. We all know someone that never made it to retirement. Life is about balance. Good financial planning has to contemplate enjoying the pre-retirement years as well as being able to continue a comfortable lifestyle in retirement.
From a planning perspective, being able to measure someone’s probability of outliving their money in a reliable fashion is key. Advisors incorporating a likely evolving asset allocation (remember – today’s asset allocation might not be the best indication of what it will be in 5, 10, or 30 years), dynamic inflation scenarios along with dynamic portfolio returns, and 2nd to die mortality probabilities into a financial plan goes a long way to improve the efficacy of the results. Ultimately there is no “right” probability of running out of money. This is a very personal choice. While financial planners can offer guidance, ultimately each individual must be able to live with their own decision.
Perhaps the very best way to mitigate the chances of a broken plan is to measure and update frequently. Much like a well visit to the doctor is scheduled to catch an adverse condition or illness early – while it’s most treatable, regular financial planning is our best defense against future breakage. Examining small changes to someone’s probability of outliving their funds is the best way to course correct where needed. It is always much easier to make small revisions to one’s financial plans than be forced to make draconian changes later in life.
The future of Social Security in the United States is hotly contested. Both current and future retirees are concerned that the retirement income they’ve been promised won’t be there and should be excluded from financial plans. We’re going to examine the current state of affairs as well as some of the popular notions of Social Security reform. Will the likely changes, if they occur, be enough to secure the future of Social Security?
The current state of affairs
Social Security brings in revenue in the form of taxes on wage earners. Employees and employers each contribute 6.2 percent of employee wages, for a total of 12.4 percent. This is the primary source of funding for Social Security’s main expense, the monthly income benefit paid to retirees. When revenues exceed expenses, as has been the case generally for many years, the surplus is invested in U.S. Treasury securities, collectively known as the Social Security Trust Fund. Currently that Trust Fund stands at $2,892 billion. That portfolio of treasury securities also generates interest, which serves as a secondary source of revenue for the Social Security system. Total revenue for the Social Security system in 2017 was $997 billion, of which $874 billion came from taxes on wages, $38 billion from benefit taxes, and $85 billion from interest on the Trust Fund.
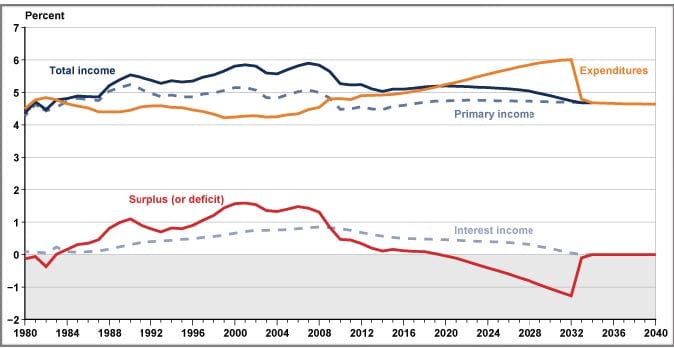
While the numbers sound promising, the problem generally lies in the population’s shifting demographic. Baby boomers are beginning to retire, and this combined with progressively longer lifespans means the ratio of workers to retirees is declining.,. As of 2018, there will no longer be an annual surplus, but rather an annual deficit as the amount paid in benefits exceeds the revenues for Social Security, with the shortfall currently being covered by interest on the Trust Fund. The deficit is projected to grow year by year if the current system remains unchanged, with the Trust Fund facing complete depletion by 2034.. At that point, the projected revenues will be about 79 percent of the total expenses of the system and Social Security would NOT be able to fulfill its stated obligation.
(Chart 1 shows Trust Fund total income exceeding Trust Fund expenditures from 1984 through 2017, generating annual surpluses. Beginning in 2018, total income is projected to be less than expenditures, generating annual deficits (shown as negative surpluses).
Now, this would be a pretty disastrous situation for many Americans who rely on their Social Security checks, thus causing the current widespread fear. However, contrary to popular misconceptions, this would not actually be the end of the Social Security system because the majority of its funding would still be covered by revenue from those still working. It would mean that as of 2034, either all benefits would be cut by approximately 21% or some people would not receive those benefits and others would receive more than 79% of their stated benefits.
Let’s examine some of the popular proposals to remediate the failing Social Security System.
Increase the age of full retirement for younger workers. This is perhaps the most intuitive solution to many simply because people are living longer and healthier lives, enabling them to work longer and still have a lengthy retirement. When Social Security was first enacted in 1935, the average life expectancy of a newborn was 61. In 2017, the average life expectancy of a newborn [in the U.S.] is 78.5 yrs. Perhaps a more meaningful statistic is the change in life expectancy of someone at full retirement age (FRA). In 1935, a 65-year-old had a life expectancy of 78 yrs. In 2016, a 67-year-old (full retirement age for those born after 1960) had a life expectancy of 84. So the eligible age for full retirement has only increased by two years (from 65 to 67), while the average lifespan for a 65-year old has increased by six years (from 13 to 17), meaning only one-third of the increase in life expectancy is being accounted for! In 1983, the full retirement age of 67 for Social Security benefits was officially enacted after a gradual implementation over 22 yrs. This was done slowly to protect those getting close to retirement and only create a small impact for those a few more years away from retirement. If further increases to the full retirement age are enacted, it seems likely that a similar, gradual approach would be taken. Perhaps an FRA of 68 (+2 mo/yr) for those born between 1966-71, FRA of 69 (+2 mo/yr) for those born between 1972-77 and FRA of 70 for those born after 1978. This would likely create a benefit reduction (if claimed at minimum age) of 45 percent at an FRA of 70 years compared to 25 percent for an FRA of 66 and 30 percent for an FRA of 67.
Increase the cap on wages on which Social Security is taxed. While this would increase revenues for Social Security, it would also increase future expenses, as benefits have historically been limited by the same cap. However, the Social Security benefit formula only includes 15 percent of the wages earned above $5,397/mo, which is far below the cap of $10,700/mo in 2018. Eliminating the tax cap would solve approximately 30 percent of the anticipated shortfall in Social Security over the next 75 years.
Increase the percentage taxed on wages to pay for Social Security. Covering the shortfall would necessitate an increase now of 2 percent. If we wait until 2034, the increase in taxes would have to be 3.3 percent to reach a total of approximately 15.7 percent, as the current 12.4 percent rate is only projected to cover 79 percent of Social Security’s expenditures when its reserves run out.
Decrease current or future planned benefits. A 13 percent overall benefit cut would solve 75 years of the shortfall, or the government could wait until 2033 and then slash benefits by 21-23 percent.
Means test benefits. Reducing benefits for those with a high income in retirement is a popular proposal among some, who believe that those with greater income in retirement don’t need Social Security. This is a complex proposal for several reasons. First, some legal experts believe that the implied covenant between workers contributing to Social Security and the U.S. government is that they would receive those benefits upon retirement. Others believe that not providing the stated benefit would violate this agreement. Now, one could make a similar argument that simply delaying full retirement could also constitute a breach of agreement. So, let’s look at the practical impact of Means Testing. If those with retirement income above the cap of $256,800 (2018’s wage base cap x 2; married couples) received no benefit, this would equate to approximately 1 percent of retirees whose taxable income exceeded the taxable wage cap. Because of the small population of high-income retirees, this is expected to only cover approximately 10 percent of the shortfall if it were enacted immediately, and the impact if enacted years down the road would be even smaller.
Conclusions
From a financial planning perspective, only one of the solutions above would cause an elimination of benefits, which would only potentially apply to a small number of clients (approximately 61 million receive Social Security, but only 1 percent are top earners, which would result in about 600,000 eliminated beneficiaries). To generate $250,000 in taxable income, a retired married couple would have to have dividend and interest income on a portfolio of roughly $10 million [2.50% x $10 million = $250,000) or have a traditional IRA required minimum distribution (RMD) on a portfolio of roughly $5 million (250k/27.4 yrs = $9124.09 RMD). Since this cap has historically increased with inflation, those portfolio sizes represent today’s dollars for general magnitude.
For most of America, the absolute worst case regarding Social Security would be if nothing is done and they received only 79 percent (decreasing to 73 percent over 75 years) of their promised benefit. Since there are a number of seemingly reasonable alternatives to this scenario, it appears that situation is unlikely. However, clients looking to be extremely conservative in their planning could choose to plan for only 79 percent of their stated benefit. It seems clear that removing Social Security altogether from the plan would be too conservative for all but the wealthiest Americans.
As with many solutions, the most likely event here may be a combination of adjustments. Increasing the retirement age gradually on today’s younger workers may be the most palatable. The more delayed this change is, the more likely other supplemental changes may also have to be included, such as an increased cap on wages taxed or an actual increase in the tax rate itself. Since means testing doesn’t actually cover a large portion of the shortfall, it may be less likely to be part of the equation.
The bottom line is that the Social Security system may be in dire need of reform, but it’s not going away.
What should advisors actually DO when it comes to financial plans for clients?
Delay the expected age of full retirement for clients under 50 without increasing expected benefits. (Note that in 1983 individuals with fewer than 20 years until full retirement were spared any delays). Delaying a year for every 6 years younger than 50 is both practical (2 months for each year later someone was born was the formula used in 1983, although there was a hiatus for those born between 1943 and 1954) and realistic. For example, expect a 44-year old would have full retirement age of 68 and a 38-year old would be delayed to 69, while those 32 or under would have a full retirement age of 70.
Exclude Social Security for those with likely taxable income of $250k (present value) or more in retirement. This is likely a client with $10mm+ in taxable assets or $5mm+ in traditional IRA/401k assets, or substantial defined benefit pension income or other taxable income sources. Don’t forget to adjust for inflation, meaning in 28 years (@ 2.5% inflation) that annual income threshold would likely be something more like $500k/yr. For those clients in this situation, it may be prudent to exclude social security benefits to ensure that they can sustain their lifestyle, even without Social Security benefits.
1 “Trust Funds Summary.” SSA. Accessed August 01, 2018.
24 Sass, Steven A., Alicia Haydock. Munnell, and Andrew Eschtruth. The Social Security Fix-it Book: A Citizens Guide. Chestnut Hill, MA: Center for Retirement Research at Boston College, 2007.
27 Sass, Steven A., Alicia Haydock. Munnell, and Andrew Eschtruth. The Social Security Fix-it Book: A Citizens Guide. Chestnut Hill, MA: Center for Retirement Research at Boston College, 2007.
During a recent appearance on RVN-TV, Tolerisk founder Mark Friedenthal joined host Bill Borton to discuss the importance of risk tolerance assessments in investing. Mark explained that identifying a good custom risk directive is something that many in the advisory industry often find difficult, and said, “I think of it as the Goldilocks exercise. You don’t want risk to be too high, or too low. You want to find the perfect balance of what’s right for that client at that time.” Finding this balance is a unique science that challenges advisors. With this challenge in mind, Mark weighed in on the benefit that Tolerisk can provide to advisors, and explained that the financial technology tool uses a psychometric profile and cash-flow chronology to more accurately represent a client’s willingness and ability to take risk.
Throughout the segment, Bill and Mark touched on a variety of other topics, such as the genesis of Tolerisk. Mark explained the “a-ha” moment when he realized that advisors needed a better way to measure risk tolerance for their clients. “The SEC’s description of risk tolerance acknowledge the client’s willingness to accept risk and ability to take risk, pointing to two separate exercises, and we needed to figure out a way to measure them separately and combine them intelligently. When it comes to ability to take risk, I took my experience in managing large fixed income and derivatives portfolios for big financial institutions and took traditional fixed income mathematics and pointed it towards household cash-flows. That became a very unique approach to computing a client’s risk,” he says.